Friday 30 November 2018

Collectors in Hygieia

          In previous post, we learned how to do end user set up in Hygieia with screenshots. In the current post, we can discuss what is collector in Hygieia and what are the collectors available in Hygieia.

  • What is Collector in Hygieia ?

The collector in Hygieia fetches the data from the DevOps tools and saves into MongoDB database. Hygieia uses MongoDB as the database for storage and retrieval of data.


Collector Work Flow in hygieia


For each collector, data saves different mongodb collection, e.g bitbucket data will save into commits collection, bamboo build data will save into builds collection and udeploy environment data will save into environment_component collection.

  • How to run Collector in Hygieia ?

Generally, you can run the collectors using the following command,


java -jar <Path to collector-name.jar> --spring.config.name=<prefix for properties> --spring.config.location=<path to properties file location>


      You may choose the collectors applicable to your DevOps toolset from the list of supported collectors. In addition, you may write your own collector and plug it in to match your DevOps toolset.


  • Supported Collectors

Hygieia supports the following collectors:

  1. Build Collectors - Jenkins, Bamboo, Jenkins-codequality, Jenkins Cucumber & Sonar
  2. Cloud Collectors - AWS.
  3. Deploy Collectors - uDeploy, XLDeploy
  4. Feature Collectors - Jira, VersionOne, Gitlab & Rally.
  5. Miscellaneous Collectors - Chat Ops & Score.
  6. SCM Collectors - Bitbucket, GitHub, Gitlab, Subversion & GitHub GraphQL.
  7. Performance Collector - AppDynamics.
  8. Configuration Management Database (CMDB) - HP Service Manager (HPSM).
  9. Library Policy - Nexus IQ.
  10. Artifact Repository - Artifactory.

  • Creation of Encrypted Key for private Repo's

       Encryption for private repositories requires that you generate a secret key and add it to your repository settings files. The steps for encrypting private repositories are as follows,

Step 1: From the core module, generate a secret key.

 java -jar <path-to-jar>/core-2.0.5-SNAPSHOT.jar com.capitalone.dashboard.util.Encryption


Step 2: Add the generated key to the API properties file.

 api.properties

 key=<your-generated-key>


Step 3: Add that same generated key to your repository settings file. This key is required for the target collector to decrypt your saved repository password.

For example, if your repo is GitHub, add the following to the github.properties file:

 github.properties,

 github.key=<your-generated-key>


Related Posts:--

Thursday 29 November 2018

Hygieia End User Configuration

           In previous post, we learned how to set up Hygieia and given some sample properties files. In the current post, we can configure the Hygieia as shown in the below steps.


1) Create User

         There are two users to access the Hygieia dashboards.
  • Admin 
  • Other Users
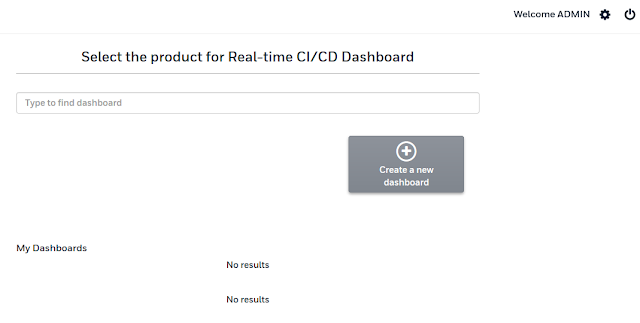
When you start UI using gulp serve , will see below home page of Hygieia.

hygieia login page

        The admin can do the following things,

  • Select a theme for the dashboard
  • Manage user and admin accounts for the dashboard
  • Set up API tokens for authentication
  • Create and manage custom dashboard templates

Create Admin:--

To create an account for an admin user:
  • Click Signup on the login page.
  • Enter admin as the username, specify and confirm the password, and then click Signup.
Username should be admin.
Hygieia signup page

Create other users also same as admin, don't give admin as username.


2) Create Team Dashboard

To create a new team dashboard:-
       In the Team Dashboards tab, click Create a new dashboard. This invokes the Create a New Dashboard screen.
Hygieia home page

Create New Dashboard screen,


Create new team dashboard in hygieia

Next, Widget Management,
select the required widget to show in the team dashboard.

Widget management in hygieia

The team dashboard contains the following views,

  • Widget View
  • Pipeline View
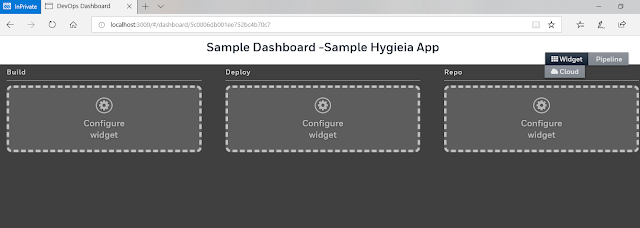
Team Dashboard Configuration in hygieia


I have configured build, deploy, repo widgets and pipeline view.
After all above configuration, the team dashboard of hygieia looks like below diagram,


Sample Team Dashboard of Hygieia


3) Create Product Dashboard

Before creating a product dashboard, ensure that the following prerequisites are met,


  • A Team Dashboard is created
  • Build and Code Repo widgets are configured on the team dashboard


        The process to create a Team Dashboard and configure the widgets is explained in the above step 2.

Create New Product Dashboard:--

Click on Create New Dashboard in home page of hygieia, add required information as shown in the below screen shot.


Creation Of Product dashboard in hygieia


After that it will create the product dashboard, without any information.

Hygieia product dashboard

Add Team Dashboard in the product dashboard, click on "Add Team"


Finally the Product Dashboard got created with commit, build and deploy commit information(stad. deviation, average time, total commit flags, and latest build) as shown below screenshot.


product dashboard of hygieia

Thanks for visiting blog.


Related Posts:-
1) Hygieia Developer Setup
2) Hygieia Architecture
3) Hygieia Introduction
4) Collectors in Hygieia

Wednesday 28 November 2018

Hygieia Developer Setup

         As we know that Hygieia is open source DevOps tool and source code is available in the Capital One GitHub.
Set up Hygieia in Local:-

1) Install Prerequisites
The following are the prerequisites to set up Hygieia,
  • Java (Java 1.8 is recommended)
  • Maven
  • Git
  • MongoDB

2) Download or Clone Hygieia
    You can download or clone Hygieia from the GitHub Repository in your local.

3)  Build Hygieia

Run maven build from Hygieia root directory, use any one of the below mvn commands.


mvn clean install package
 
(or)
 
mvn clean install package -Dmaven.test.skip=true
 
(or for Skipping PDM Violations)
 
mvn clean install package -Dmaven.test.skip=true -Dpmd.failOnViolation=false


If everything is build fine, will display the below screen shot,

Hygieia mvn build screen


as a result of this commands, will generate the .jar file of all components. The .jar file is located in the \target folder for each component of Hygieia, including collectors.


4) Start MongoDB database  and create user in the database.

If you don't have mongo db database, download and install from mongo db website.

Create database dashboard using command - create database dashboard.

Create user admin in the database dashboard using below query,

db.createUser(
              {
                user: "admin",
                pwd: "admin",
                roles: [
                     {role: "readWrite", db: "dashboard"}
                     ]
              })


5) Run api and required collectors

We need to provide the properties file in run time while running the api and collectors. Properties file contains database name, database password, db host, port and some other required information.

Use below command to run the api,

java -jar api.jar --spring.config.location=C:\[path to]\Hygieia\api\dashboard.properties

Sample api dashboard.properties file,

dbname=dashboard
dbhost=localhost
dbport=27017
dbusername=admin
dbpassword=admin
server.port=8080
server.contextPath=/api
key=key for private repo access

Samething run required collector jars, like repo collector(bitbucket as example), build collector(Bamboo as example) and deploy collector (Udeploy as example).

Ex:-- bamboo collector

java -jar bamboo-build-collector-2.0.5-SNAPSHOT.jar --spring.config.location=<path of hygieia>\collectors\build\bamboo\bamboo.properties

Contents of sample bamboo.properties file,

dbname=dashboard
dbusername=admin
dbpassword=admin
dbhost=localhost
dbport=27017
dbreplicaset=false
dbhostport=localhost:27017
bamboo.cron=0 0/5 * * * *
bamboo.servers[0]=https://bamboo.domain.com/
bamboo.username=username of bamboo server
bamboo.apiKey[0]=apiKey of bamboo


6) Run UI using gulp serve command.

Run UI using gulp serve, in UI root directory.

Automatically it will open the browser with URL http://localhost:3000/


This is all about Hygieia local set up. Thanks for visiting blog.


Related Posts:--
1)  Hygieia Introduction
2)  Hygieia Architecture
3) Hygieia End User Configuration
4) Collectors in Hygieia

Sunday 25 November 2018

Hygieia Architecture

          In previous post, we discussed the Hygieia introduction with sample screenshot of Team Dashboard and Product Dashboard.  In the current post, we will learn the delivery pipeline and Hygieia architecture.

          First we need to understand the Continuous Delivery(CD) pipeline,

           The continuous delivery pipeline is an automated set of processes that use tools to compile, test, and deploy code for new software features. The purpose of a continuous delivery (CD) pipeline is to create a continuous management and release setting where bugs, compatibility issues, and security breaches are identified and fixed as early as possible.

Stages of Delivery Pipeline:--
Continuous Delivery Pipeline

Stages of Delivery Pipeline


Hygieia Architecture :--

        The below diagram shows the architecture of Hygieia which contains mainly UI Layer, API Layer and Collector's Layer.

       
hygieia architecture
Hygieia Architecture
       

 Hygieia Layers:-

      There are 3 main layers of Hygieia Dashboard as follows,

  • Collector Layer
  • API Layer
  • UI Layer


1) Collectors Layer :--

           The main job of the collector is, it will collects the Data from DevOps tool and save that data into the MongoDB & each and every DevOps Tool having their own collector written by Hygieia team. There are build collectors(Jenkins, Bamboo), code repo collectors(GitHub, Bitbucket) and deploy collectors(UDeploy, XLDeploy) and so on.


2) API Layer:--

      API is work as an Interface between Collectors and UI. It will take request from the UI and using REST API it will return the requested data from MongoDB to the UI.


3) UI Layer

     The UI layer  is Hygieia’s front- end and contains all the Graphical User Interface (GUI) elements for users to view. It is here where users are also able to configure the dashboard.  There are two types of dashboards, Team Dashboard and Product Dashboard.


Related Posts:--